Search
CompuSoft logo

Dashboards and Business Intelligence

Get ultimate insight with CompuSoft Dashboards and Business Intelligence. CompuSoft Dashboard is an interactive and graphical tool with versatile options for graphical visualization of your data.

CompuSoft Dashboards offer many informative tiles

Dashboards og Business Intelligence

Follow your business up close

Graphs and colors show all important key figures

Dashboards og Business Intelligence

Dashboards og Business Intelligence

CompuSoft Dashboard offers an interactive and graphical tool with many versatile options for graphic visualization of your data. 


Dashboard collects and combine data from across your business. Thus, your data is visualized via live dashboards and autogenerated reports. Customize your dashboard with your most important KPIs so you are always up to date with the most important data. 


With clear graphs and diagrams you can see the overall performance of your business at a glance and closely monitor cash flow, revenue, bookings, ticket sales, and compare with other periods. 

Graphs and colors show all important key figures - both in the past, present, and the future

Dashboards allow you to easily compare your data and follow any developments in the figures.


You gain insight into how your company is performing compared to previous periods and what you can expect from the future.


Get the ultimate insight and stay up to date with income, bookings, arrivals, and departures. 

CompuSoft Dashboard is an indispensable tool for those who want full insight into their company.

Graphs and colors show all important key figures - both in the past, present, and the future

Configurable graphic modules (tiles)

CompuSoft Dashboard offer replaceable and fully adapted and configurable graphic modules, which compile your data from different data sources and give you a better understanding of how your different business departments interact. 

Configurable graphic modules (tiles)

Now it's easier to plan your company's resource allocation

The web version provides all the same viewing options as the PC version. This means that you can easily monitor all activities in your business and meet potential challenges in a timely manner and more easily plan the company's resource allocation.


(The web version is available to all CompuSoft users with online booking or data-gateway. Enter the link compusuite.dk/dashboard in your browser to access dashboards from, for example, your mobile phone.)
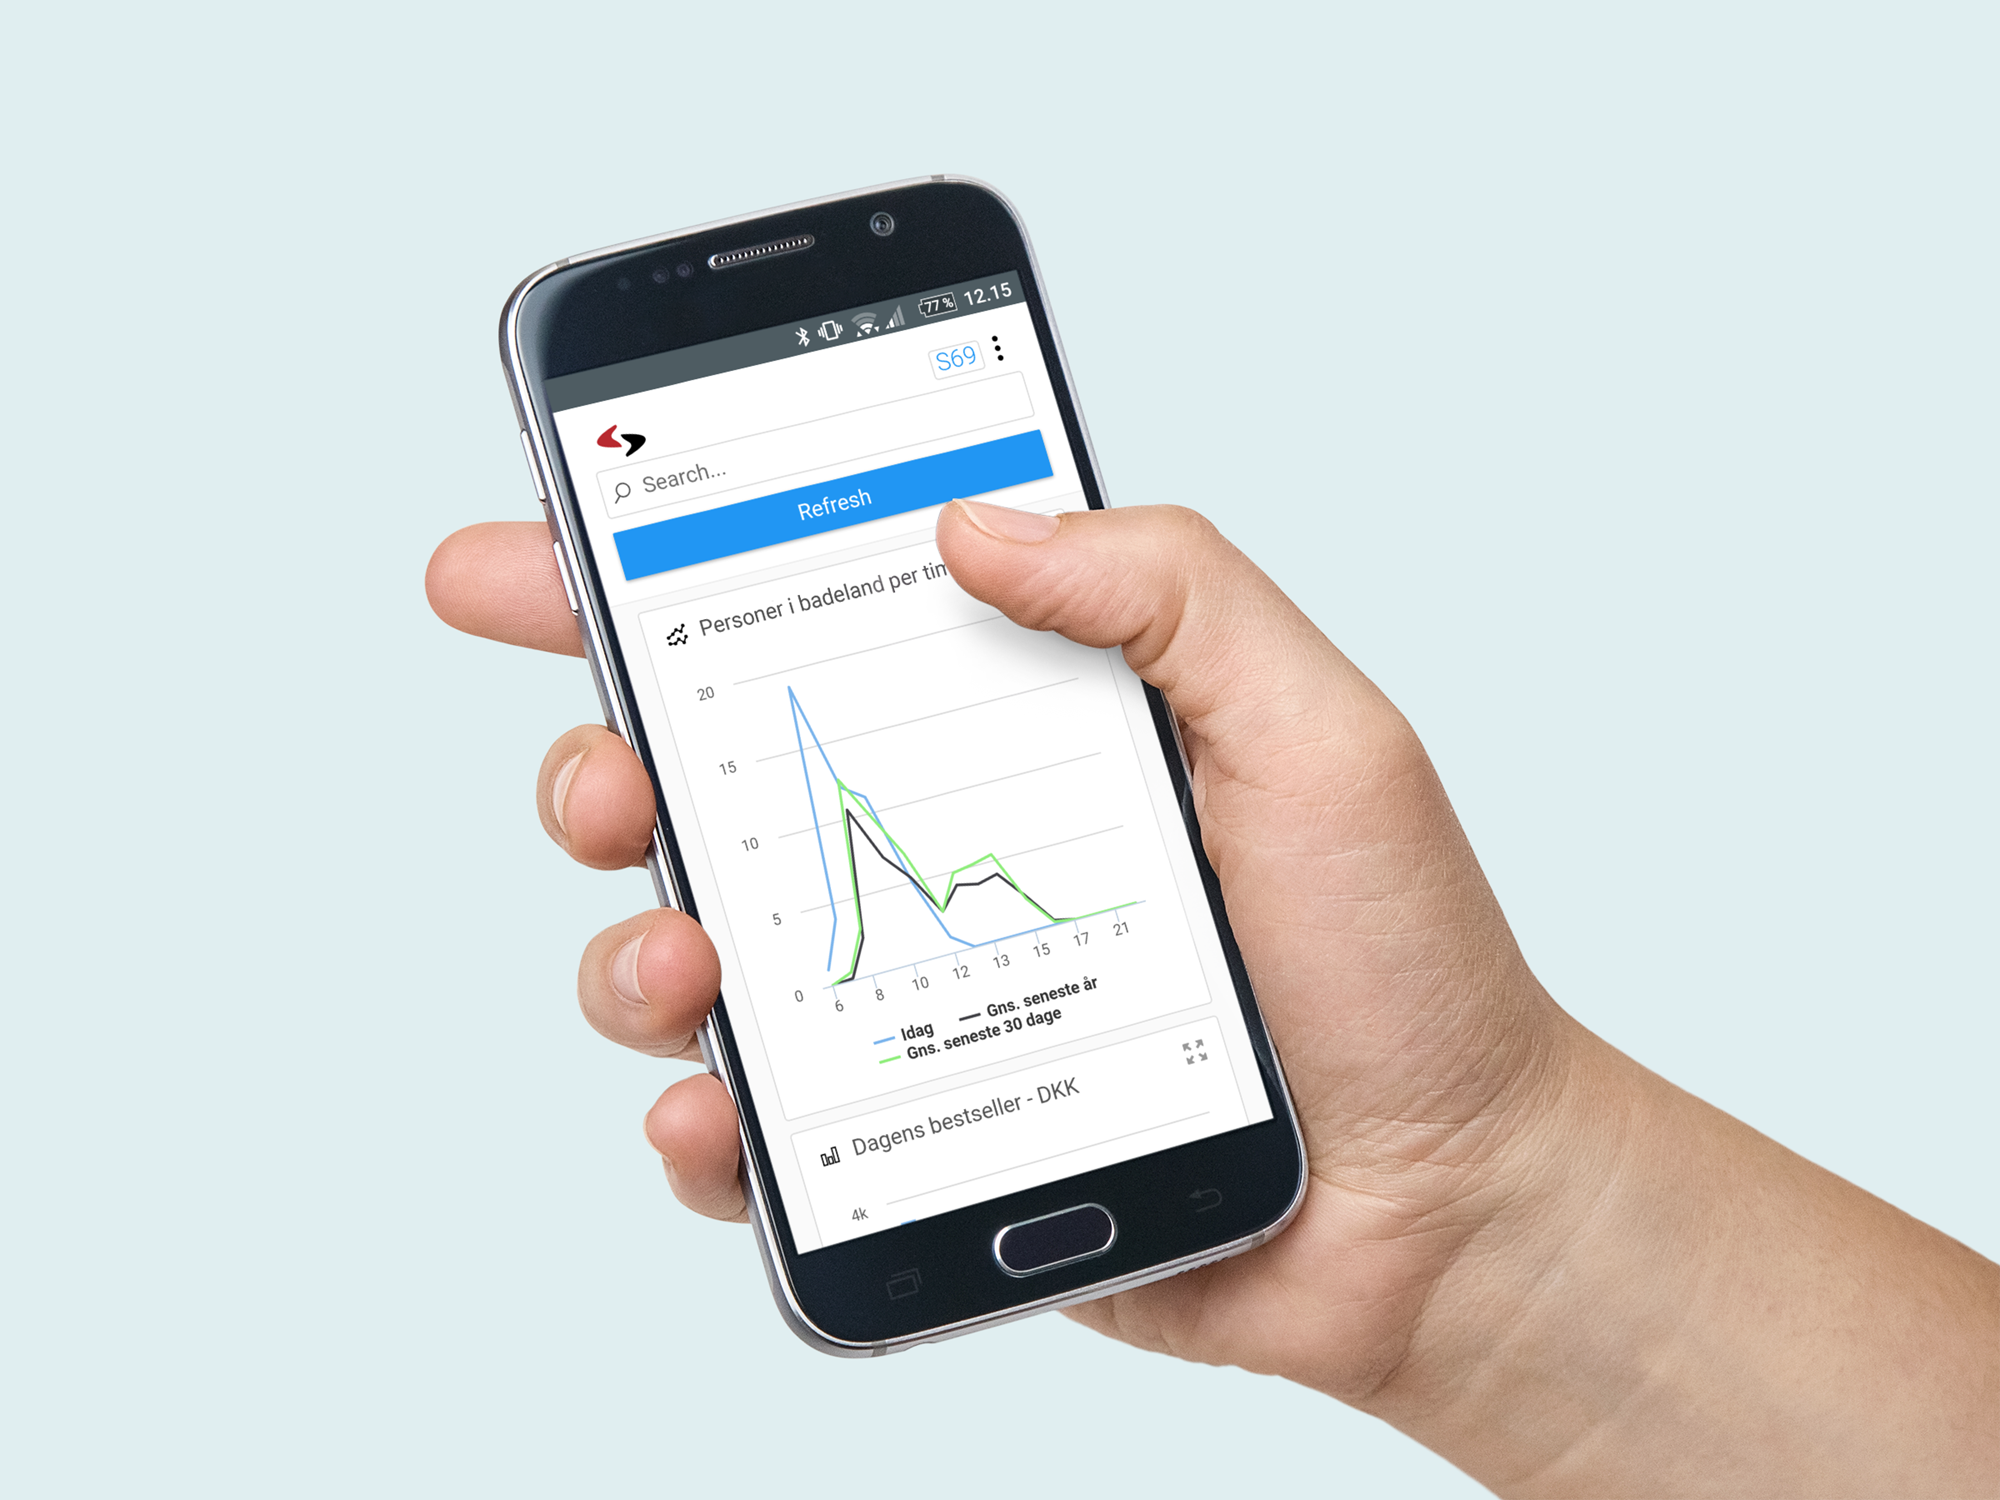
Dashboards promote planning and marketing

CompuSoft Dashboards collects data from the booking system and presents live info about your company. It gives you a great overview and makes it easier to plan the staff's working day. You can also see clear graphs at any time for detailed analysis of your company's revenue, where your guests come from, how many of the guests are repeat visitors, and much more. All very important information that promotes your marketing.


All modules present 100% up-to-date live data, and your Dashboard can, in addition to the many included modules, be tailored and expanded endlessly.

...

Information screen for guests and staff

From the PC version of the Dashboard, you can design your dashboard as you wish, and there are plenty of included modules that you can insert. You can rearrange and place the components in the order you want and personalize them using different color themes. You can add as many components as you want and remove those you do not need. The Dashboard also has the option that you can create new share-friendly pages with selected information that you can share with e.g. your guests on an information screen or with your employees.

Icon 1

Customize your Dashboard

You control how many modules you want to display at a time, how many pages your Dashboard should contain, whether to automatically switch pages with a given pause, and most importantly, which modules you want to display.


The Dashboard is designed to make your experience of the booking system even better and streamline your administration and reception, while also providing valuable statistics and key figures about your business. The Dashboard offers a host of possibilities.

Icon 2

Visualize your ideas

If you have special wishes for your dashboard in addition to the many included modules, we offer to tailor and design your ideas for effective dashboard modules. You may need a special presentation of your booking data, statistics or information from your CompuMat devices. Also imagine a Dashboard on a big screen in your reception, where you present relevant information to guests and employees regarding activities and events in your business. The Dashboard offers a host of possibilities.

Icon 3

Streaming video and live video feeds

For example, if you have automatic license plate recognition connected to your CompuMat access control or parking system, you can stream the video directly to your dashboard and, from the same window, access the customer's information based on the vehicle's license plate. In addition, you can of course interact with live video feeds, such as weather forecasts, News, YouTube videos, etc.

Web-Dashboard

Enter the link compusuite.dk/dashboard in your browser. The web version of the Dashboard provides all the same viewing options as the PC version. This means that you can easily stay informed about the development of your business and counter potential problems. This results in fewer worries, better customer service and efficient administration. The web version is available to all CompuSoft users with online booking or data-gateway.

All data from your booking and access control system can be compiled in every way.


We make it easier for you to keep up to date with your business. CompuSoft Dashboard generates easy-to-understand key figures based on your data and shows you a comprehensive overview of your business flow.

These Dashboard components are the most widely used in our tourism companies:


Booking:

  • Number of bookings by product type and customer type
  • Number of bookings this year compared to last year
  • Number of visiting guests right now
  • Number of arrivals and number of departures


Marketing:

  • Where your bookings come from (from phone calls, online booking, booking channels, attendance at the reception, etc.)
  • Where your visitors come from (interactive map)
...

Sales statistics:

  • Sales for the period divided into products
  • Today's top-selling products
  • Today's top-selling clerk
  • Total turnover and distributed per cash terminal and clerk and compared to other periods


Statistics from CompuMat access control system:

  • Statistics on the use of your facilities
  • Statistics on electricity and water consumption
  • Staff numbers, how many are at work right now
  • Overview of barrier systems and license plate recognition


Live video feed from your surveillance cameras

  • Video feed from parking areas
  • Video feed from playground and swimming pool
  • Video feed from your CompuMat barrier system and license plate recognition


Internet services

  • Live video feeds from local weather forecasts, news, YouTube, etc.

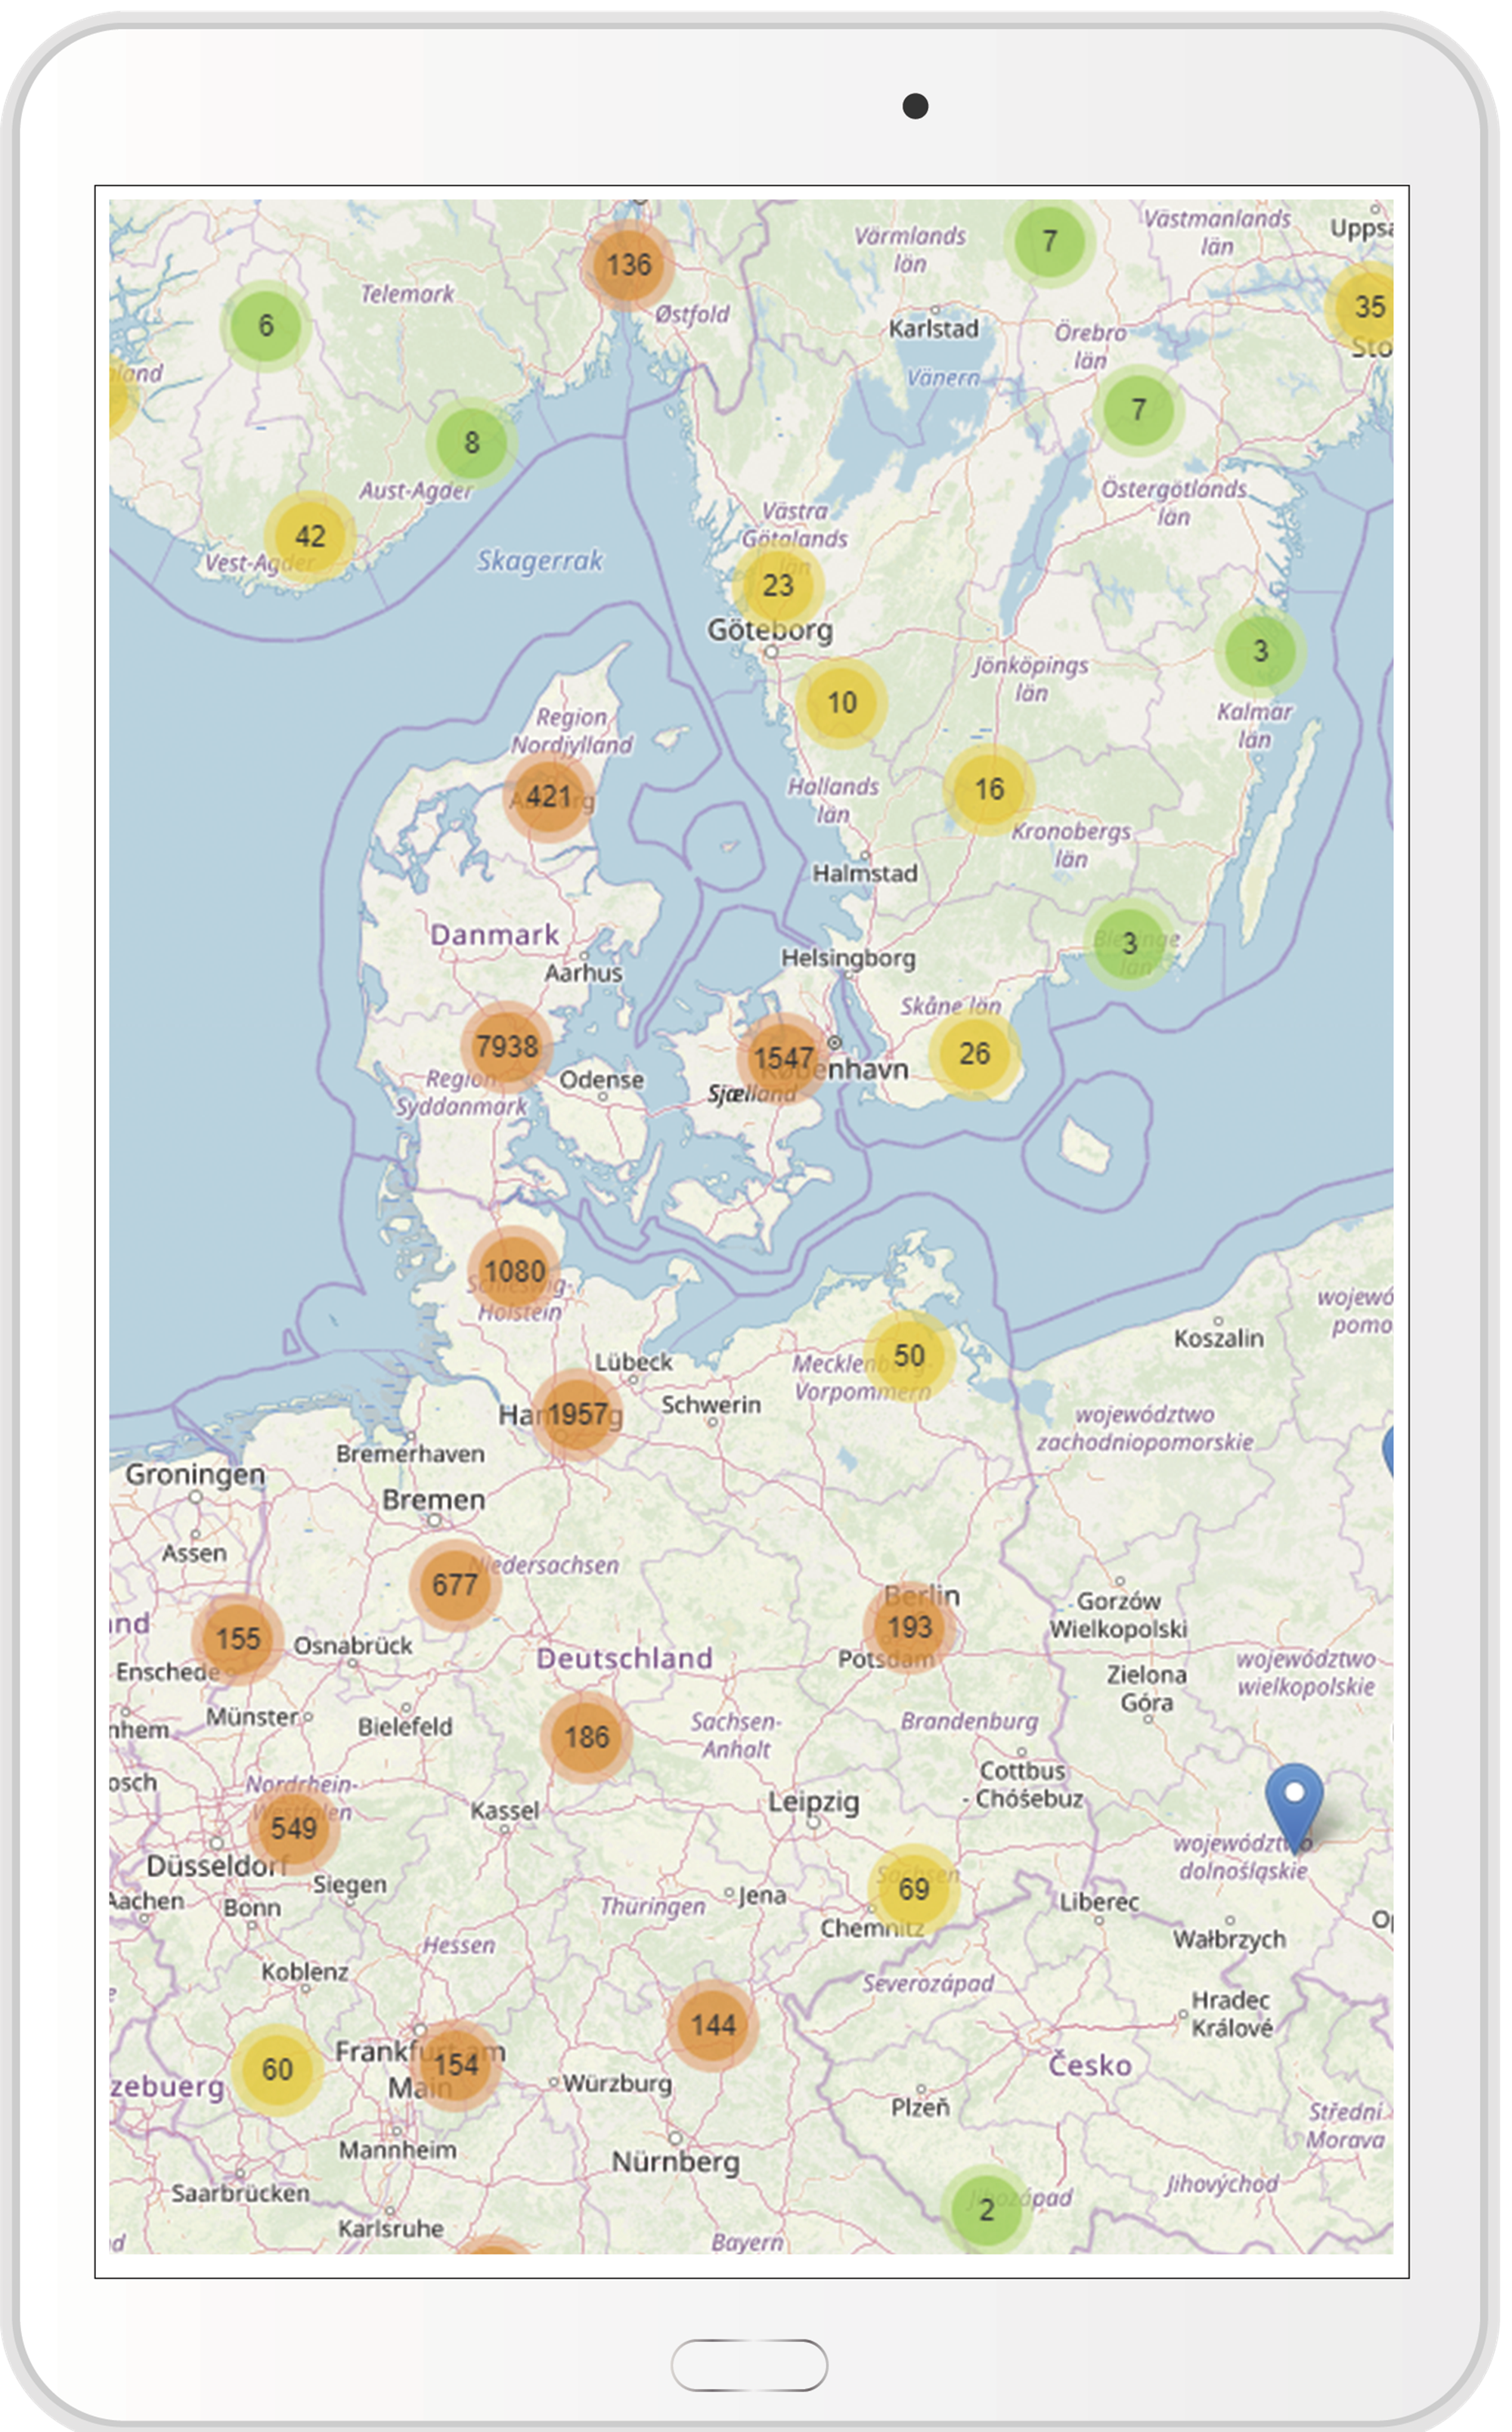
Do you know where your visitors are from?

Sweden, Norway, Denmark, Germany, Holland, Italy, etc. Do you know where your guests are from?
With this feature, you get an interactive map that shows which countries and areas your guests come from.


Data is based on your registered bookings and shows one guest per booking. If necessary, use the information to aim your marketing efforts towards specific geographical areas. Zoom in and out on the map by scrolling with the mouse or clicking on the numbers in the yellow and green circles to see further details about the locations.